Reporting Your Symptoms
Follow these simple steps to contribute to your community's health awareness. Your anonymous report helps neighbors understand local symptom patterns in real-time.
Open SneezeMap on Your Device
Visit SneezeMap on your computer or mobile device. The platform works best on modern browsers. We support:
- Chrome (desktop & mobile)
- Safari (desktop & mobile)
- Edge (desktop & mobile)
- Firefox mobile (desktop version has known issues)
Allow Location Permission
When you click "Report Symptoms," your browser will ask for permission to access your location. This is safe and necessary because:
Your location is immediately randomized and obfuscated before any data is transmitted to our servers.
We never store your precise location or personal information.
What to expect: Your browser will show a permission popup at the top of the screen. Click "Allow" to proceed with symptom reporting.
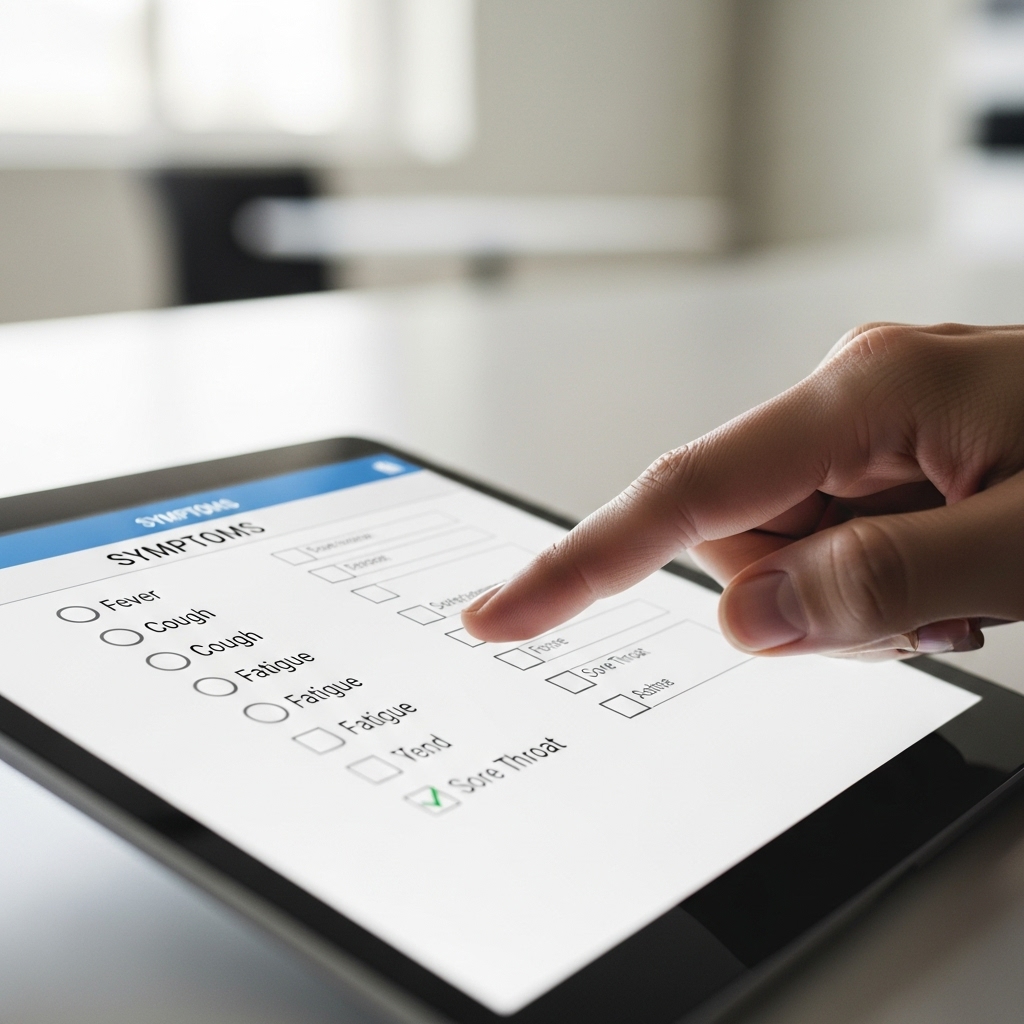
Report Your Symptoms
Select any symptoms you're experiencing from the checklist. You can choose multiple symptoms:
- Cough
- Fever
- Difficulty breathing
- Loss of taste or smell
Privacy reminder: Your report is completely anonymous. We don't collect your name, email, or any identifying information.
Submit and See Your Impact
Click "Submit Report" to send your symptom data to the map. Within seconds, your anonymized report will appear as part of the local symptom pattern in your area.
Your contribution helps your community understand emerging health patterns in real-time.
Common Issues & Solutions
If you accidentally clicked "Don't Allow," you can reset permissions:
- Chrome: Click the lock icon in the address bar → Site settings → Location → Reset
- Safari: Preferences → Privacy → Location Services → Find SneezeMap and reset
- Firefox mobile: Settings → Apps → Permissions → Location → Reset
Location accuracy varies by device and network conditions. GPS on mobile devices is generally more accurate than browser-based location. Your data is intentionally randomized for privacy protection, so slight variations are expected and normal. The aggregate pattern across many reports is what matters for identifying trends.
This usually means your browser cannot access location data. Try:
- Make sure location services are enabled on your device (Settings → Privacy → Location Services)
- Try a different browser if you're on desktop
- Use mobile browser instead of desktop for better GPS access
- Ensure you're not in private/incognito mode (some browsers disable location in private mode)
Firefox desktop has known compatibility issues with our location services. We recommend:
- Use Chrome, Safari, or Edge on desktop for the best experience
- Use Firefox mobile, which works well
- Try the latest version of Firefox if you prefer to stay on desktop
Your Privacy is Protected at Every Step
Your location is randomized before transmission • No personal data is collected or stored • Your report is completely anonymous • You can report as many times as you want • Your data helps create a real-time community health picture
Exploring the Map
Learn how to navigate the symptoms map and get the most relevant local insights for your area. The map is designed to help you understand symptom patterns in your community and make informed decisions.
Zoom & Navigate
Use your mouse or touch gestures to zoom in and out of different regions. Zoom in to see neighborhood-level detail, or zoom out to view regional patterns. The map updates in real-time as new symptom reports come in.
Layer Controls
Toggle different symptom categories on and off to focus on specific health indicators. You can view respiratory symptoms, fever reports, or other symptom types individually to identify patterns most relevant to you.
Understanding the Map Display
Color Coding
Colors represent symptom density in each area. Lighter colors indicate fewer recent reports, while darker or more vibrant colors show areas with higher concentrations of symptom reports. This helps you quickly identify where symptoms are currently emerging in your region.
Density Indicators
Hover over or tap on map clusters to see the number of symptom reports in that area. Higher density doesn't necessarily mean more cases—it reflects community participation. The more people report, the clearer the picture becomes for everyone.
Time Filters
Use the time filter to view symptom reports from the last 24 hours, 7 days, or longer periods. Recent data (last 24 hours) shows emerging patterns, while longer timeframes reveal broader trends in your area.
Tips for Getting the Most Relevant Local View
Focus on Your Area
Zoom to your neighborhood or local district to see hyperlocal symptom patterns. This gives you the clearest picture of what's happening in your immediate community where you interact daily.
Watch for Trends
Look at changes over time rather than single snapshots. A gradual increase in reports over several days is more significant than a single day's spike, which could reflect reporting timing rather than true change.
Remember: This Is Early-Warning Data
SneezeMap shows where symptoms are emerging now, not confirmed cases. It complements official statistics, which typically lag by days or weeks. Use this for community awareness, not medical diagnosis.
More Participation = Better Data
Areas with higher community participation show clearer patterns. If your neighborhood has few reports, consider sharing SneezeMap with neighbors to build a more complete picture.
What the Data Means for Your Area
An increase in symptom reports in your area suggests emerging illness activity. This is valuable early-warning information that helps your community stay informed before official statistics catch up.
Consistent symptom levels indicate stable community health conditions. Steady data is actually reassuring—it shows what "normal" looks like for your area.
Fewer symptom reports suggest improving conditions in your community. Combined with other data sources, this helps track progress in managing illness in your area.
Areas with few reports don't necessarily mean fewer symptoms—it may just mean fewer people are using SneezeMap. Encourage neighbors to participate for a more complete community picture.
Ready to explore your local symptom patterns? Start by zooming to your area and filtering for recent data. Every report helps your community stay informed.
View the Map NowTroubleshooting Common Issues
We've encountered some common technical challenges from our community. Here's how to solve them—and what we're working on to improve.
Firefox Desktop Compatibility Issues
The Problem:
Some Firefox desktop users experience issues when reporting symptoms or loading the map, particularly with location permission handling.
The Solution:
- Try a different browser (Chrome, Edge, or Safari work reliably)
- Update Firefox to the latest version—we've resolved issues with older versions
- Clear your browser cache and cookies, then reload the page
- Check your Firefox privacy settings: Location sharing should be allowed for SneezeMap
- Try Firefox's Private Browsing mode to rule out conflicting extensions
We're Working On It: We're actively investigating Firefox compatibility and have improvements in development. Thank you for your patience.
Location Accuracy Problems
The Problem:
Your symptom report appears far from where you actually are, or the map shows inaccurate location clustering.
Why This Happens:
Browser location APIs rely on IP geolocation, WiFi networks, and GPS signals. On desktop, IP-based location can be off by miles. Mobile devices with GPS are much more accurate. Additionally, we intentionally randomize your exact location slightly for privacy protection—your report might appear a few blocks away from your actual position.
How to Improve Accuracy:
- Use mobile: Report symptoms from your smartphone for GPS-level accuracy
- Enable location services: Make sure your device's location is turned on
- Connect to GPS: On mobile, give the browser a few seconds to acquire GPS signal before submitting
- Understand the randomization: We intentionally blur your exact location by a few blocks—this is a privacy feature, not a bug
- Check your WiFi: On desktop, WiFi location accuracy depends on your router's location database
Important: The aggregate pattern of many reports is accurate even if individual locations vary slightly. Your contribution helps the community picture regardless of a few blocks of variance.
Browser Permission Pop-ups & Privacy Concerns
The Problem:
When you visit SneezeMap, your browser asks for permission to access your location. This feels invasive, and you may worry about what happens with that data.
Why We Need It:
We need your location to show your symptom report on the local map. Without it, we can't map your contribution to your community. The permission request comes from your browser, not SneezeMap—it's a security feature protecting your privacy.
How Your Data Is Protected:
- Location is randomized: Your exact GPS coordinates are obfuscated before being sent to our servers
- No personal data collected: We don't store your name, IP address, email, or device information
- No tracking: We don't follow you across the web or build a profile of your movements
- Anonymous by default: Your report is completely anonymous—we have no way to identify you
- Temporary data: Older reports are aggregated and eventually anonymized further
How to Grant Permission Safely:
- When your browser asks "Allow location access?", click "Allow" or "Allow Once"
- You can revoke permission anytime in your browser settings
- The permission only lasts for your current session
- You can check browser settings to see what sites have location access
Your Privacy Matters: Read our full privacy policy for detailed information about how we handle your data. We're transparent because trust is everything for a crowdsourced health platform.
Mobile vs Desktop: Which Should You Use?
Best for Reporting: Mobile
- ✓ More accurate location (GPS)
- ✓ Faster permission handling
- ✓ Report symptoms on-the-go
- ✓ Better touch interface
- ✓ Works reliably across browsers
Best for Exploring: Desktop
- ✓ Larger map view
- ✓ Easier to zoom and pan
- ✓ Better for detailed analysis
- ✓ Multi-monitor setup possible
- ✓ Chrome/Edge recommended
Pro Tip: Use mobile to report your symptoms (more accurate), then explore the map on desktop for a better overview of your community.
Known Limitations & What We're Doing
Browser Support:
SneezeMap works best on modern browsers. Chrome, Edge, and Safari are fully supported. Firefox is supported but has occasional location handling issues we're investigating.
Location Services:
Desktop location accuracy depends on your IP geolocation, which can be imprecise. Mobile with GPS is significantly more accurate. Intentional location randomization means your report may appear a few blocks from your actual position—this is by design for privacy.
Data Freshness:
The map updates in real-time as reports come in, but there may be a slight delay (usually under 1 minute) before your submission appears due to server processing.
Self-Reported Data:
Remember that SneezeMap data comes from self-reported symptoms, not confirmed COVID-19 tests. It's meant to be an early-warning system that complements official surveillance, not a replacement for it.
We're Committed to Improvement: We actively monitor community feedback and are continuously working to improve browser compatibility, location accuracy, and overall platform stability. Thank you for your patience and participation.
Still Having Issues?
If you've tried these solutions and still encounter problems, the SneezeMap community on Reddit is active and helpful. Many users share their experiences and solutions there.
You can also report bugs or suggest improvements—your feedback directly shapes how we prioritize fixes and features.